Final Days of GSoC 2019
Hello Friends! Final Evaluation is coming and this brings the GSoC project to an end. I believe it is my duty to let you know all about my contributions to Labplot during this project. I will try to make this post self-contained and will try to cover every detail. Let's try to answer some general questions. If something is left, please feel free to comment, I will get back to you asap.
You can either, import data from a file (CSV and other formats) or SQL database directly to this spreadsheet.
Now, you just have to choose the columns on which test is to be performed, along with other options in the dock.

Note that only valid columns related to the tests will be shown.
There can be cases where, you don't have the access to the whole data, but you have the statistics of data like a number of observations, the sample mean, sample standard deviations or you have data in the form of the contingency table. These cases mostly occur in case of Z-Test (as data is huge) or in Chi-Square Test for Independence, and hence currently this second alternative is available only for these two tests. For other tests, the implementation can be extended in future.
So, the second alternative is the statistic table. In Statistic Table you can fill the data and then can continue with the test.
Here are the Statistic Tables for Z-Test and Chi-Square Test for Independence.
You can enter data in these empty cells.
For Z-Test Statistic Table: Row Header (vertical header) is editable and you can give your own names to them
For Chi-Square Statistic Table: Both Row and Column Headers are editable. Moreover, you can change the number of rows and number of columns of this table dynamically from here in the dock:

Reducing the number of rows/columns can erase the data for those reduced columns/rows. Increasing again will create new cells.
 Using Export to Spreadsheet, you can export this contingency table to a spreadsheet. Three columns will get appended to the spreadsheet after clicking on it by names: Independent Var.1, Independent Var2 and Dependent Var. Now, you can save the spreadsheet and next time you can simply open the spreadsheet and perform the test without having to fill the contingency table.
 You can clear all the cells of the table using a clear button at the end of the table. Notice, none of the header's content will get erased using this.


 Using this you can finally perform a statistical test.
What all Statistical Tests got added?
This is the final list of statistical tests which got added during the course of the project:- T-Test
- Two-Sample Independent
- Two Sample Paired
- One Sample
- Z-Test
- Two-Sample Independent
- ANOVA
- One Way ANOVA
- Two Way ANOVA
- Levene Test: To check for the assumption of homogeneity of variance between populations
- Correlation Coefficient
- Pearson's R
- Kendall's Tau
- Spearman Rank
- Chi-Square Test for Independence
So as many of you must have noticed, I have added almost all the features which I have promised in the proposal. For one or two which are left (noted down in TODO), all the basic structure is already created and it will not be that difficult to complete them in future.
These features are tested using automatic unit testing.
How these statistical tests can be selected?
You can choose a test using these beautiful docks.
For T-Test, Z-Test and ANOVA, you have to go to Hypothesis Test Dock and for Correlation Coefficient, you have to go to Correlation Coefficient Dock.
 |
| Hypothesis Test Dock |
 |
| Correlation Coefficient Dock |
Here is the live demo. It will show you how to reach these docks and what all tests are available.
What should be Data Source Type to run these tests?
Currently, you can perform the tests on the data contained in the spreadsheet. Labplot has its own spreadsheet.
 |
| Spreadsheet |
You can either, import data from a file (CSV and other formats) or SQL database directly to this spreadsheet.
Now, you just have to choose the columns on which test is to be performed, along with other options in the dock.

Note that only valid columns related to the tests will be shown.
There can be cases where, you don't have the access to the whole data, but you have the statistics of data like a number of observations, the sample mean, sample standard deviations or you have data in the form of the contingency table. These cases mostly occur in case of Z-Test (as data is huge) or in Chi-Square Test for Independence, and hence currently this second alternative is available only for these two tests. For other tests, the implementation can be extended in future.
So, the second alternative is the statistic table. In Statistic Table you can fill the data and then can continue with the test.
Here are the Statistic Tables for Z-Test and Chi-Square Test for Independence.
 |
| Chi-Square Test for Independence Statistic Table |
 |
| Z-Test Statistic Table |
You can enter data in these empty cells.
For Z-Test Statistic Table: Row Header (vertical header) is editable and you can give your own names to them
For Chi-Square Statistic Table: Both Row and Column Headers are editable. Moreover, you can change the number of rows and number of columns of this table dynamically from here in the dock:

Reducing the number of rows/columns can erase the data for those reduced columns/rows. Increasing again will create new cells.
Using Export to Spreadsheet, you can export this contingency table to a spreadsheet. Three columns will get appended to the spreadsheet after clicking on it by names: Independent Var.1, Independent Var2 and Dependent Var. Now, you can save the spreadsheet and next time you can simply open the spreadsheet and perform the test without having to fill the contingency table.You can clear all the cells of the table using a clear button at the end of the table. Notice, none of the header's content will get erased using this.What are these extra options in the Docks?
You can uncheck this checkbox to remove the assumption of the equality of variance between both population means.
Press Levene's Test button to check for homogeneity of variance. Equality of variance is assumed by default. For Two-Sample Independent T-Test, you can select whether to make this assumption or not but for One-Way ANOVA this assumption must be valid.
Change Significance level from here. The default value is 0.05.

Set the null and alternate hypothesis from here.
For Two-Sample Tests:
μ = Population Man of Independent Var1
μₒ = Population Man of Independent Var2
For One-Sample Tests:
μ = Population Mean of Independent Var
μₒ = Assumed Population mean
For One-Sample Tests, you can set the assumed population mean from here.

This option is visible when the statistical tests can take variable 1 to be categorical such that variable 2 becomes the dependent variable. This checkbox is automatically checked when column mode in Independent variable 1 is TEXT. You can also check this option manually if the column contains class labels in numeric form.
So Finally! How to perform statistical tests on the data?
I will show you various live demos. For the first demo, I will import data from a file, but for later demos, I will directly start from a pre-filled spreadsheet.
These examples are taken from various websites and open-source application like JASP, etc.
Demo for Two-Sample Independent T-Test. Here, I will also show you the use of checkbox Independent Var. 1 Categorical.
Now, I will give you a demo example of calculating Two-Sample Independent Z-Test using Statistic Table:
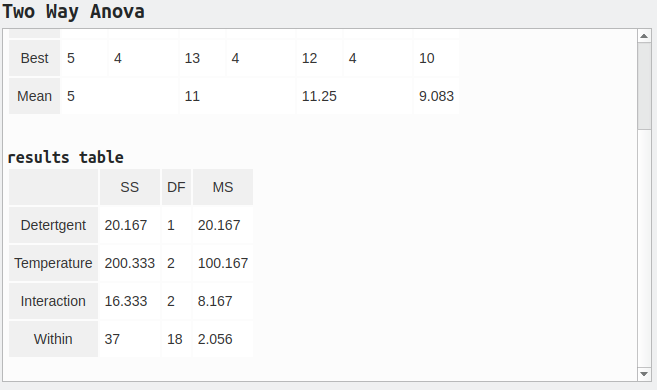
This is demo example od calculating Two Way ANOVA


<-------------------------------Result View


This also brings me to the end of the GSoC project. It was a very pleasant journey. I learnt a lot during these 3-4 months. I wouldn't have reached here without all the help and support of my mentors (Stefan Gerlach and Alexander Semke). They both are most chilled out persons I have worked up with and they had calmed and helped me a lot in difficult times and never got frustrated while correcting my stupidest mistakes. Huge Clap for Both of Them. 👏👏👏
This is a demo example of calculating the Pearson Correlation Coefficient Test:
This demo shows how to calculate the chi-square test for independence if you have contingency table and how to convert that table in a spreadsheet.
How does Result Look like?
Hopefully, you must have seen video demos till now. There you must have seen many result tables. I have also tried to explain what all each element in results view/table is.
The Result view can be divided into these three parts:
<-------------------------------Title

<--------------------------------Summary View

<-------------------------------Result View
In Summary view, you can see the summary of the data in the form of tables and texts. It is a QTextEdit Widget. The additional feature I have added is the ability to show different tooltips for separate words. There is no direct method for such a feature, so I have to subclass ToolTipTextEdit from QTextEdit. These tables are actually HTML Tables which are automatically generated by code. Since QTextEdit is HTML aware, so using HTML Tables gives the user feature-rich experience.
The Result view shows you the final result of the statistical test. It will also show errors in red colour if it encounters some error while performing the test. Here also, you can see the tooltip, but here tooltip is for every line and not for every word.
Here are the screenshots of some results.


What is left to do?
- Add more tooltips in Result and Summary
- Check for assumptions using various tests (like Levene's Test).
- Reimplement above features for data source type: Database.
- Integrate various tests in one workbook to show a summary to the user in a few clicks.
- All other minor TODOs are already written as comments in source code itself.
What are the future goals?
We aim to generate a single self-contained report for the data, currently analysed by the user. This report will show the statistical analysis summary and graphs in one place, at a single click, without the need of the user to explicitly select or instruct anything unless he/she feels the need of doing so. The idea is to make the task of data analysis easy for the user and give him/her the freedom to play around with the data while keeping track of the changes occurring in different statistical parameters.
The Conclusion
So finally! you made till the end of the post! Kudos to you.
This also brings me to the end of the GSoC project. It was a very pleasant journey. I learnt a lot during these 3-4 months. I wouldn't have reached here without all the help and support of my mentors (Stefan Gerlach and Alexander Semke). They both are most chilled out persons I have worked up with and they had calmed and helped me a lot in difficult times and never got frustrated while correcting my stupidest mistakes. Huge Clap for Both of Them. 👏👏👏
Google Summer of Code 2019 may be ending but this is a start for me in this huge and friendly open source community. I will try to be as active here as possible and will not stop working on this project.
There are many things left to be done but I think the basic structure is made already during this project and in future, these features can be extended very nicely.
Thank you all for reading this till the very end. Will meet you all soon with new blog posts till then take care, bubye... Alvida, Shabba Khair, Tschüss
This comment has been removed by a blog administrator.
ReplyDelete